Most subscribers to my research distribution list know me from the writing, but a lot has been built around it — a forecasting model, a dashboard, an iPhone app, market summary emails, SMS alerts. Most of it is free. This is a quick tour.
My background is in investment banking research for 33 years, ultimately heading up the Australian coverage of utilities and building materials at UBS and having additionally covered Infrastructure (tollroads and airports) at JP Morgan.
I write my research for three reasons.
- It defines me, it’s what I do. Publishing research and having people take it seriously keeps you sharp. Facts have to be checked. Not too many adjectives. What value am I adding, what’s everyone else saying?
- It keeps my name and ITK’s name in circulation and that leads to some consulting opportunities.
- It puts something back into the community — something I never had time for previously with four kids and a big job. I am well placed to add value, and to recognise our role as stewards for future generations.
My background — training in writing and marketing research, plus a computing thread going back to 1970 (as a UNSW tutor I ported a word processor from the Apple IIe to a Commodore Pet in 6502 assembler) — turned out to suit dashboard work. Increasingly I use AI (Claude) as a productivity tool.
Three years ago half by accident I worked with Paul Bandarian, an engineer interested in electricity, to build a full half-hourly spot forecasting model. Over two years we, or that is mainly he, built that model. It’s not a full network representation like you would get in PLEXOS, although two constraints are modelled, and capacity is provided exogenously year by year. Other than that it’s a reasonably complete model using an optimised linear program to dispatch every 30 minutes and with a weather-aware battery dispatch algorithm. Although Paul is no longer with me, I’m proud of the model.
For instance I recently used it to look at the optimal capacity mix in a coal-free NEM in 2045. I tested 11 different solar, wind and BESS capex inputs to understand what difference high capex wind relative to Gencost would mean for the portfolio.
It can answer questions like: what would the best supply portfolio be for a customer like Tomago? How do prices and generator returns move in bad weather years compared to average? What’s going to happen to spot price volatility? Get in touch if you’d like to know more.
Otherwise I offer a free dashboard that was recently redesigned to load faster. You can find a lot of stuff in there. It might not be what you want because I designed it for myself.
There is a companion iPhone app you can apply to subscribe for.
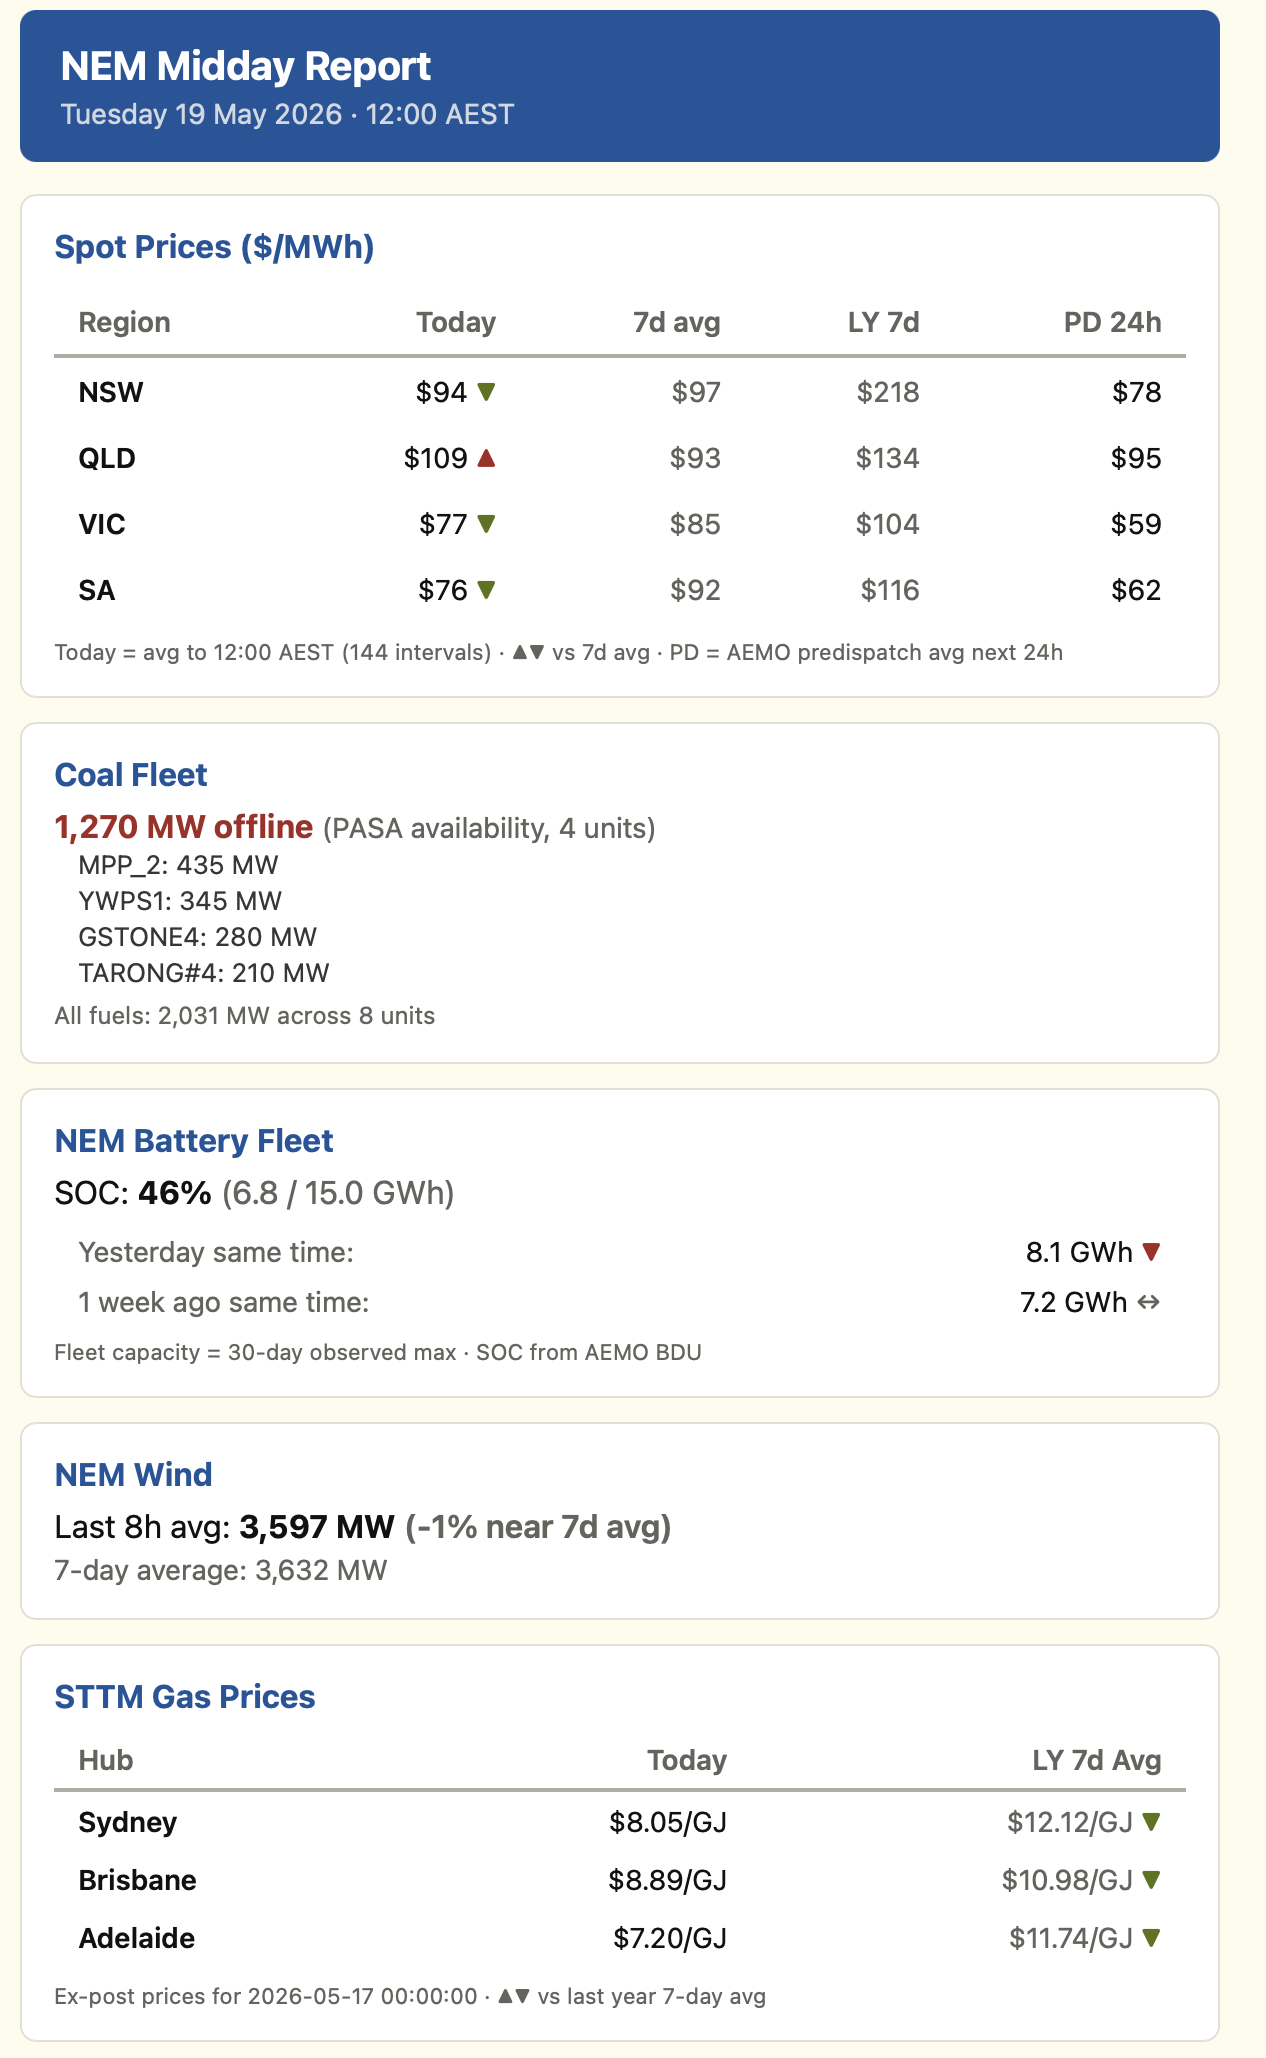
Because I used to get lunchtime and evening market summaries at UBS, I have the system send me emails. The lunchtime one is a quick daily glance at what’s happening — see screenshot below. The evening version focuses on peak prices. You can subscribe to either.
I also run some SMS alerts — high price events, new DUIDs entering the system, battery fleet SOC records by region, and so on. I’m not yet making those available unless people want to pay.
None of this, other than the price forecasting, is particularly difficult to do, but I’ve done it and that can be to your advantage.
I have never previously advertised these services, I don’t really want to get in anyone’s way and in any case the data is stored on my server which can probably get overloaded quite easily. If it does I might put a login on the dashboard. The whole thing, as professional as it looks, runs on a shoestring budget.
Working in isolation — even with the podcast and LinkedIn — it’s easy to go off the reservation. Please get in contact if you have a well-reasoned point of view, or if my analytical and forecasting services could be of value to you or your organisation. I am a good listener.